
Decision trees work like maps that guide decision-making through simple questions and clear answers. Widely used in Machine Learning, they stand out for their simplicity and interpretability. In this article, you’ll learn how these trees work, understand why they are so effective for classification, and discover how to apply them in your projects.
What is a Decision Tree?
A decision tree is a hierarchical structure composed of:
- Internal Nodes: These represent questions or conditions (for example, “Is the age greater than 30?”).
- Branches: They connect the nodes and direct the answers (for example, “Yes” or “No”).
- Leaf Nodes: These contain the final classifications or predictions.
Imagine you want to predict whether a person will buy a ticket for a concert. A decision tree might ask questions like:
- Is the person over 25 years old?
- Is the concert’s genre their favorite?
- Is the ticket price affordable?
Based on the answers, the tree makes the final decision.
How Do Decision Trees Work?
Building a decision tree involves finding the best splitting points (splits) to separate the data into homogeneous groups. This process uses metrics such as:
- Information Gain: Measures the reduction in uncertainty after each split.
- Gini Index: Evaluates the impurity of the nodes, indicating how mixed the classes are.
Example:
In a dataset about customers and their purchasing preferences, the tree identifies the most relevant features (such as age, income, and musical preference) to create splits that result in groups with similar characteristics.
Use Cases for Decision Trees
Decision trees can be applied in various scenarios, such as:
- Medical Diagnoses: To identify whether a patient has a specific condition based on their symptoms.
- Customer Classification: To segment customers into groups like “potential” or “low engagement.”
- Fraud Detection: To analyze financial transactions and identify suspicious behavior.
Advantages and Limitations
Advantages:
- Easy to Understand: Even those without technical expertise can grasp the model.
- Clear Interpretation: The visual structure makes it easy to follow how decisions are made.
- Low Computational Cost: Efficient for smaller datasets and typically does not require data normalization.
Limitations:
- Overfitting: Very complex trees can become too tailored to the training data, losing the ability to generalize.
- Instability: Small changes in the data can lead to significant changes in the tree structure.
Practical Demonstration with Python
Below is a practical example of how to create a decision tree to classify flowers using the famous Iris dataset:
from sklearn.datasets import load_iris
from sklearn.tree import DecisionTreeClassifier, plot_tree
import matplotlib.pyplot as plt

# Carregar os dados
iris = load_iris()
X, y = iris.data, iris.target

# Treinar o modelo
clf = DecisionTreeClassifier(max_depth=3, random_state=42)
clf.fit(X, y)

# Visualizar a árvore
plt.figure(figsize=(12, 8))
plot_tree(clf, feature_names=iris.feature_names, class_names=iris.target_names, filled=True)
plt.show()
Result
The generated visualization shows how each attribute (for example, petal width and length) contributes to the classification, making the model easy to interpret.
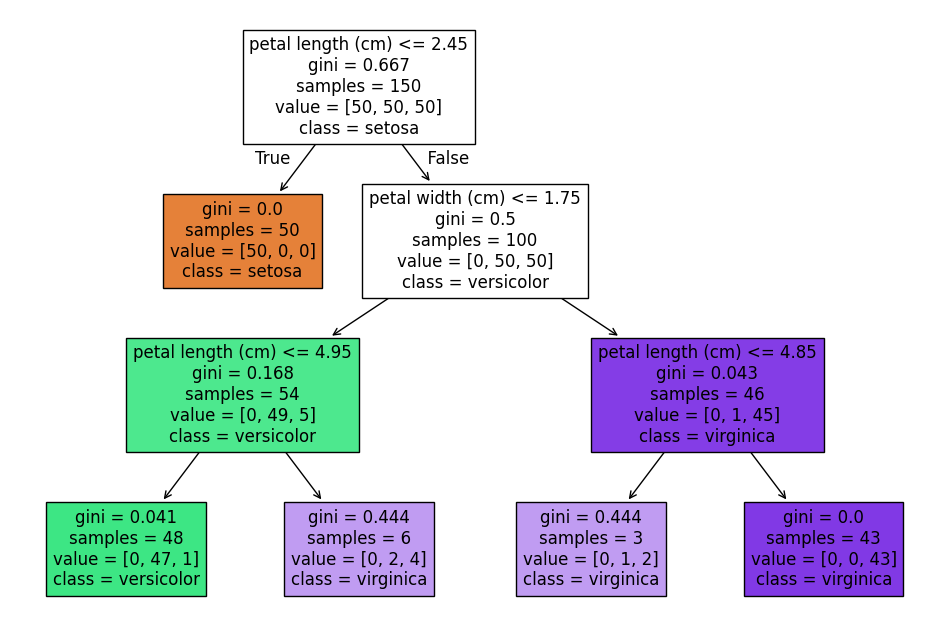
IInterpreting the Generated Tree
In the decision tree visualization, each node displays important information:
- Gini: Indicates the impurity of the node. Values close to 0 suggest that the samples are well separated.
- Samples: The number of samples that reached the node.
- Values: The distribution of classes in the node (for example,
[50, 0, 0]indicates 50 samples of the first class and none of the others). - Class: The predominant class in the node, which will be the prediction for new samples.
Example:
At the root node of the tree:
- Gini = 0.667: Shows a significant mix of classes.
- Samples = 150: All samples in the dataset are present.
- Values = [50, 50, 50]: The samples are evenly distributed among the three classes.
- Class: The predominant class might be, for example, “setosa.”
As you follow the branches, conditions such as petal length (cm) <= 2.45 help to split the samples into increasingly homogeneous groups, culminating in leaf nodes where the Gini index is 0, indicating pure groups.
Conclusion
Decision trees are powerful tools for classification, combining simplicity with effectiveness. By applying them, you not only create robust predictive models but also gain valuable insights into your data. Try using a decision tree in your next project and discover how it can transform data into intelligent decisions!
Deixe um comentário